[TTI] High Volume Close (HVC) Setup📜 ––––HISTORY & CREDITS––––
The High Volume Close (HVC) Setup is a specialised indicator designed for the TradingView platform used to identify specific bar. This tool was developed with the objective of identifying a technical pattern that trades have claimed is significant trading opportunities through a unique blend of volume analysis and price action strategies. It is based on the premise that high-volume bars, when combined with specific price action criteria, can signal key market movements.
The HVC is applicable both for swing and longer term trading and as a technical tool it can be used by traders of any asset type (stocks, ETF, crypto, forex etc).
🦄 –––UNIQUENESS–––
The uniqueness of the HVC Setup lies in its flexibility to determine an important price level based on historically important bar. The idea is to identify significant bars (e.g. those who have created the HIGHEST VOLUME: Ever, Yearly, Quarterly and meet additional criteria from the settings) and plot on the chart the close on that day as a significant level as well as theoretical stop loss and target levels. This approach allows traders to discern high volume bars that are contextually significant — a method not commonly found in standard trading tools.
🎯 ––––WHAT IT DOES––––
The HVC Setup indicator performs a series of calculations to identify high volume close bars/bar (HVC bars) based on the user requirements.
These bars are determined based on the highest volume recorded within a user-inputs:
👉 Period (Ever, Yearly, Quarterly) and must meet additional criteria such as:
👉 a minimum percentage Price Change (change is calculated based on a close/close) and
👉 specific Closing Range requirements for the HVC da.
The theory is that this is a significant bar that is important to know where it is on the chart.
The script includes a comparative analysis of the HVC bar's price against historical price highs (all-time, yearly, quarterly), which provides further context and significance to the identified bars. All of these USER input requirement are then taken into account as a condition to identity the High Volume Close Bar (HVC).
The visual representation includes color-coded bar (default is yellow) and lines to delineate these key trading signals. It then draws a blue line for the place where the close ofthe bar is, a red line that would signify a stop loss and 2 target profit levels equal to 2R and 3R of the risked level (close-stop loss). Additional lines can be turned on/off with their coresponding checkboxes in the settings.
If the user chooses "Ever" for Period - the script will look at the first available bar ever in Tradingview - this is generally the IPO bar;
If the users chooses "Yearly" - the script would look at the highest available bar for a completed year;
If the users chooses "Quarterly" - it would do the same for the quarter. (works on daily timeframe only);
While we have not backtested the performance of the script, this methodology has been widely publicised.
🛠️ ––––HOW TO USE IT––––
To utilize the HVC Setup effectively:
👉Customize Input Settings: Choose the HVC period, percentage change threshold, closing range, stop loss distance, and target multiples according to your trading strategy. Use the tick boxes to enable and disable if a given condition is used within the calculation.
👉Identify HVC Bars: The script highlights HVC bars, indicating potential opportunities based on volume and price action analysis.
👉Interpret Targets and Stop Losses: Use the color-coded lines (green for targets, red for stop losses) to guide your trade entries and exits.
👉Contextual Analysis: Always consider the HVC bar signals in conjunction with overall market trends and additional technical indicators for comprehensive trading decisions.
This script is designed to assist traders in identifying high-potential trading setups by using a combination of volume and price analysis, enhancing traditional methods with a unique, algorithmically driven approach.
在腳本中搜尋"stop loss"

Supertrend, MA 44|6, EMA FIBS 13|21|34I have this indicator based on my strategy. This indicator is based on existing functions available in the system. I haven't added anything new. This indicator uses Supertrend, MA44|6, EMA fibs 13|21|34 combining to find a profitable trade.
- Supertrend : Indicator uses supertrend strategy with default ATR period of 10 and Factor value 3. These values can be customized based on your preferences. Uptrend is denoted by green color and downtrend by red color. You can change the colors based on your preferences.
- MA 44|6: Indicator plots moving averages of 44 and 6. These values can be customized based on your preferences. Although it is highly recommended to keep 44 as is. Value 6 can be adjusted based on your preference. Default color for uptrend is green and for downtrend is red. You can change the colors based on your preferences.
- FIBS EMA 13|21|34: Indicator plots EMA of fibbonacci numbers 13, 21,34 to identify consolidation and breakout. The periods can be adjusted but it is highly recommended not to do so. Default colors for 13,21 and 34 is Aqua, Blue and Navy respectively. You can change the colors based on your preferences.
When to take trade?
To take a trade all conditions needs to be fulfilled.
Supertrend : Always take a trade in the direction of Supertrend. It is always advisable to take trade if the trend is changing or price is taking support of resistance.
MA 44|6: Moving average 44 indicates average price of 44 last candles and 6 for last 6 candles. Price crossing MA 44 indicates change in trend. It is advisable to take trade at crossing the line above or below. If many candles closing near MA 44 then it indicates consolidation. The more far the candle closes from MA44 the better. MA 6 is used to identify when to enter or exit the trade. If candle closes away from MA 6 then you can wait for candle to start near the MA 6 line. If candle closes above/below MA 6 you can exit your trade.
Fibonacci 13|21|34: When all lines are closed it indicates consolidation. When price breakouts to either direction you can take a trade in that direction with following conditions.
Bullish Trade:
When to enter?
If candle closed above MA 44, Supertrend is uptrend and EMA Fibs are moving away and are above MA 44. The price is near to MA 6 line then you can enter into bullish trade. If price is away from MA 6 then you should wait until the price/line comes near to avoid loss.
When to exit?
Price moving in opposite direction:
You should set a stop loss when you enter the trade. The stop loss can be set below the low of the previous candle or any other strategy you have. But it is really important to set the stop loss. If price moves in opposite direction then your stop loss will hit and you will be out of the trade.
Price moving in same direction:
Once you enter the trade you can exit based on two conditions whichever suits you.
1. Exit the trade if candle closes below MA6. The drawback is you may exit too early. You can also adjust the period based on your preferences.
2. Exit the trade if candle closed below low of previous candle. The drawback is you may book less profit but you can capture the movement very well.
Bearish Trade:
When to enter?
If candle closed below MA 44, Supertrend is downtrend and EMA Fibs are moving away and are below MA 44. The price is near to MA 6 line then you can enter into bearish trade. If price is away from MA 6 then you should wait until the price/line comes near to avoid loss.
When to exit?
Price moving in opposite direction:
You should set a stop loss when you enter the trade. The stop loss can be set below the low of the previous candle or any other strategy you have. But it is really important to set the stop loss. If price moves in opposite direction then your stop loss will hit and you will be out of the trade.
Price moving in same direction:
Once you enter the trade you can exit based on two conditions whichever suits you.
1. Exit the trade if candle closes below MA6. The drawback is you may exit too early. You can also adjust the period based on your preferences.
2. Exit the trade if candle closed below low of previous candle. The drawback is you may book less profit but you can capture the movement very well.
When not to take trade?
1. If MA 44 is completely horizontal and EMA Fibs are very close to each other. This indicates that the market is consolidated and if you enter the trade you may hit stop loss very often.
Note: Please note that I am not expert and I don't take any responsibility of your profits or losses. I have created this indicator based on my knowledge and it is for study purpose. Use of this indicator is totally your responsibility. Use all your knowledge and expertise and don't totally depend on the indicator. Don't forget to use stop loss and do money management.
Happy Trading!

Profit Guard ProProfitGuard Pro
ProfitGuard Pro is a risk management and profit calculation tool that helps traders optimize their trades by handling position sizing, risk management, leverage, and take profit calculations. With support for both cumulative and non-cumulative take profit strategies, this versatile indicator provides the insights you need to maximize your trading strategy.
How to Use ProfitGuard Pro:
Load the Indicator: Add ProfitGuard Pro to your chart in TradingView.
Set Your Entry Position: Input your desired entry price.
Define Your Stop Loss: Enter the price at which your trade will exit to minimize losses.
Add Take Profit Levels: Input your TP1, TP2, TP3, and TP4 levels, as needed.
If you want fewer take profit levels, adjust the number of TPs in the settings menu. You can choose between 1 to 4 take profit levels based on your strategy.
Adjust Risk Settings: Specify your account size and risk percentage to calculate position size and leverage.
Choose Cumulative or Non-Cumulative Mode: Toggle cumulative profit mode to either recalculate position sizes as each take profit is hit or keep position sizes static for each TP.
Once set up, ProfitGuard Pro will automatically calculate your position size, leverage, and potential profits for each take profit level, providing a clear visual on your chart to guide your trading decisions.
Key Features:
Risk Management:
Calculate your risk percentage based on account size and stop loss.
Visualize risk in dollar terms and percentage of your account.
Position Size & Leverage:
Automatically calculate the ideal position size and leverage for your trade based on your entry, stop loss, and risk settings.
Ensure you are trading with the appropriate leverage for your account size.
Cumulative vs Non-Cumulative Profit Mode:
Cumulative Mode: Adjusts position size after each take profit is reached, recalculating for remaining contracts.
Non-Cumulative Mode: Treats each take profit as a separate calculation using the full position size.
Take Profit Levels:
Set up to 4 customizable take profit levels.
Adjust percentage values for each TP target, and visualize them on your chart with easy-to-read lines.
Profit Calculation:
Displays potential profits for each take profit level based on whether cumulative or non-cumulative mode is selected.
Calculate your risk-reward ratio dynamically at each TP.
Customizable Visuals:
Easily customize the table's size, position, and color scheme to fit your chart.
Visualize key trade details like leverage, contracts, margin, and profits directly on your chart.
Short and Long Position Support:
Automatically adjusts calculations based on whether you're trading long or short.

Mile Runner - Swing Trade LONGMile Runner - Swing Trade LONG Indicator - By @jerolourenco
Overview
The Mile Runner - Swing Trade LONG indicator is designed for swing traders who focus on LONG positions in stocks, BDRs (Brazilian Depositary Receipts), and ETFs. It provides clear entry signals, stop loss, and take profit levels, helping traders identify optimal buying opportunities with a robust set of technical filters. The indicator is optimized for daily candlestick charts and combines multiple technical analysis tools to ensure high-probability trades.
Key Features
Entry Signals: Visualized as green triangles below the price bars, indicating a potential LONG entry.
Stop Loss and Take Profit Levels: Automatically plotted on the chart for easy reference.
Stop Loss: Based on the most recent pivot low (support level).
Take Profit: Calculated using a Fibonacci-based projection from the entry price to the stop loss.
Trend and Momentum Filters: Ensures trades align with the prevailing trend and have sufficient momentum.
Volume and Volatility Confirmation: Verifies market interest and price movement potential.
How It Works
The indicator uses a combination of technical tools to filter and confirm trade setups:
Exponential Moving Averages (EMAs):
A short EMA (default: 9 periods) and a long EMA (default: 21 periods) identify the trend.
A bullish crossover (EMA9 crosses above EMA21) signals a potential upward trend.
Money Flow Index (MFI):
Confirms buying pressure when MFI > 50.
Average True Range (ATR):
Ensures sufficient volatility by checking if ATR exceeds its 20-period moving average.
Volume:
Confirms market interest when volume exceeds its 20-period moving average.
Pivot Lows:
Identifies recent support levels (pivot lows) to set the stop loss.
Ensures the pivot low is recent (within the last 10 bars by default).
Additional Trend Filter:
Confirms the long EMA is rising, reinforcing the bullish trend.
Inputs and Customization
The indicator is highly customizable, allowing traders to tailor it to their strategies:
EMA Periods: Adjust the short and long EMA lengths.
ATR and MFI Periods: Modify lookback periods for volatility and momentum.
Pivot Lookback: Control the sensitivity of pivot low detection.
Fibonacci Level: Adjust the Fibonacci retracement level for take profit.
Take Profit Multiplier: Fine-tune the aggressiveness of the take profit target.
Max Pivot Age: Set the maximum bars since the last pivot low for relevance.
Usage Instructions
Apply the Indicator:
Add the "Mile Runner - Swing Trade LONG" indicator to your TradingView chart.
Best used on daily charts for swing trading.
Look for Entry Signals:
A green triangle below the price bar signals a potential LONG entry.
Set Stop Loss and Take Profit:
Stop Loss: Red dashed line indicating the stop loss level.
Take Profit: Purple dashed line showing the take profit level.
Monitor the Trade:
The entry price is marked with a green dashed line for reference.
Adjust trade management based on the plotted levels.
Set Alerts:
Use the built-in alert condition to get notified of new LONG entry signals.
Important Notes
For LONG Positions Only : Designed exclusively for swing trading LONG positions.
Timeframe: Optimized for daily charts but can be tested on other timeframes.
Asset Types: Works best with stocks, BDRs, and ETFs.
Risk Management: Always align stop loss and take profit levels with your risk tolerance.
Why Use Mile Runner?
The Mile Runner indicator simplifies swing trading by integrating trend, momentum, volume, and volatility filters into one user-friendly tool. It helps traders:
Identify high-probability entry points.
Establish clear stop loss and take profit levels.
Avoid low-volatility or low-volume markets.
Focus on assets with strong buying pressure and recent support.
By following its signals and levels, traders can make informed decisions and enhance their swing trading performance. Customize the inputs and test it on your favorite assets—happy trading!

Average SL% Calculator with TP Levels by GorkiAverage Stop Loss And Take Profit Calculator For Futures Trading by Gorki
Description
The "Average SL% Calculator with TP Levels" script, is a simple tool for traders to plan the trades and check how much loss they are going to receive if they run this strategy. This script calculates the average price of up to four entry points, determines the percentage distance to the stop-loss level, and provides potential loss information based on margin and leverage. Additionally, it includes multiple take-profit levels to help traders systematically capture profits. Visual elements such as horizontal lines and labels make it easy to monitor key levels directly on the chart.
Why To Use This Indicator?
Risk Management: Automatically calculates the percentage distance to the stop-loss level, helping you to understand potential losses.
Profit Optimization: Supports up to four take-profit levels, enabling a structured approach to capturing gains.
Visual Clarity: Displays key levels and important information directly on the chart for easy monitoring.
Alerts: Generates alerts when the price crosses specified levels, ensuring you never miss critical trading signals.
How to Use the Script
Add the Script to Your Chart: Apply the script to your TradingView chart.
Set Input Values: Entry Points: Define up to four limit prices (LIMIT 1, LIMIT 2, LIMIT 3, LIMIT 4).
Stop-Loss: Set your stop-loss price (STOP LOSS).
Take Profits: Specify up to four take-profit levels (Take Profit 1, Take Profit 2, Take Profit 3, Take Profit 4).
Leverage: Input your leverage factor.
Margin: Enter the total margin amount for the trade.
View Calculations: The script will calculate the average entry price, the percentage distance to the stop-loss, and the potential loss based on margin and leverage.
Monitor Levels: Horizontal lines and labels will appear on the chart, showing entry points, stop-loss, and take-profit levels.
Set Alerts: Alerts will trigger when the price crosses your defined levels, helping you to take timely action.
Calculation Details
Average Price: Calculated as the mean of the specified limit prices.
Distance to Stop-Loss: Determined as the percentage difference between the average price and the stop-loss level.
Leveraged Distance: The stop-loss distance percentage multiplied by the leverage factor.
Potential Loss: Calculated by applying the leveraged distance percentage to the margin amount.
Take Profit Percentages: The percentage difference between the average price and each take-profit level.
This comprehensive indicator is a must-have for any trader looking to manage risks effectively while maximizing potential profits. Happy trading!

FVG Visual Trading ToolHow to Use the FVG Tool
1. Identify the FVG Zone
Bullish FVG: Look for green boxes that represent potential support zones. These are areas where price is likely to retrace before continuing upward.
Bearish FVG: Look for red boxes that represent potential resistance zones. These are areas where price is likely to retrace before continuing downward.
2. Set Up Your Trade
Entry: Place a limit order at the retracement zone (inside the FVG box). This ensures you enter the trade when the price retraces into the imbalance.
Stop-Loss (SL): Place your stop-loss just below the FVG box for bullish trades or just above the FVG box for bearish trades. The tool provides a suggested SL level.
Take-Profit (TP): Set your take-profit level at a 2:1 risk-reward ratio (or higher). The tool provides a suggested target level.
3. Let the Trade Run
Once your trade is set up, let it play out. Avoid micromanaging the trade unless market conditions change drastically.
Step-by-Step Example
Bullish FVG Trade
Identify the FVG:
A green box appears, indicating a bullish FVG.
The tool provides the target price (e.g., 0.6371) and the stop-loss level (e.g., 0.6339).
Set Up the Trade:
Place a limit buy order at the retracement zone (inside the green box).
Set your stop-loss just below the FVG box (e.g., 0.6339).
Set your take-profit at a 2:1 risk-reward ratio or the suggested target (e.g., 0.6371).
Monitor the Trade:
Wait for the price to retrace into the FVG zone and trigger your limit order.
Let the trade run until it hits the take-profit or stop-loss.
Bearish FVG Trade
Identify the FVG:
A red box appears, indicating a bearish FVG.
The tool provides the target price and the stop-loss level.
Set Up the Trade:
Place a limit sell order at the retracement zone (inside the red box).
Set your stop-loss just above the FVG box.
Set your take-profit at a 2:1 risk-reward ratio or the suggested target.
Monitor the Trade:
Wait for the price to retrace into the FVG zone and trigger your limit order.
Let the trade run until it hits the take-profit or stop-loss.
Key Features of the Tool in Action
Visual Clarity:
The green and red boxes clearly show the FVG zones, making it easy to identify potential trade setups.
Labels provide the target price and stop-loss level for quick decision-making.
Risk-Reward Management:
The tool encourages disciplined trading by providing predefined SL and TP levels.
A 2:1 risk-reward ratio ensures that profitable trades outweigh losses.
Hands-Off Execution:
By placing limit orders, you can let the trade execute automatically without needing to monitor the market constantly.
Best Practices
Trade in the Direction of the Trend:
Use higher timeframes (e.g., 4-hour or daily) to identify the overall trend.
Focus on bullish FVGs in an uptrend and bearish FVGs in a downtrend.
Combine with Confirmation Signals:
Look for additional confirmation, such as candlestick patterns (e.g., engulfing candles) or indicator signals (e.g., RSI, MACD).
Adjust Parameters for Volatility:
For highly volatile markets, consider increasing the stop-loss percentage to avoid being stopped out prematurely.
Avoid Overtrading:
Not every FVG is a good trading opportunity. Be selective and only trade setups that align with your strategy.
Backtest and Optimize:
Use historical data to test the tool and refine your approach before trading live.
Common Mistakes to Avoid
Entering Without Confirmation:
Wait for price to retrace into the FVG zone before entering a trade.
Avoid chasing trades that have already moved away from the zone.
Ignoring Risk Management:
Always use a stop-loss to protect your account.
Stick to a consistent risk-reward ratio.
Trading Against the Trend:
Avoid taking trades that go against the prevailing market trend unless there is strong evidence of a reversal.
Final Thoughts
The FVG Visual Trading Tool is a powerful aid for identifying high-probability trade setups. By following the steps outlined above, you can use the tool to trade with confidence and discipline. Remember, no tool guarantees success, so always combine it with sound trading principles and proper risk management

SL Hunting Detector📌 Step 1: Identify Liquidity Zones
The script plots high-liquidity zones (red) and low-liquidity zones (green).
These are areas where big players target stop-losses before reversing the price.
Example:
If price is near a red liquidity zone, expect a potential stop-loss hunt & reversal downward.
If price is near a green liquidity zone, expect a potential stop-loss hunt & reversal upward.
📌 Step 2: Watch for Stop-Loss Hunts (Fakeouts)
The indicator marks stop-loss hunts with red (bearish) or green (bullish) arrows.
When do stop-loss hunts occur?
✅ A long wick below support (with high volume) = Stop hunt before reversal upward.
✅ A long wick above resistance (with high volume) = Stop hunt before reversal downward.
Confirmation:
Volume must spike (volume > 1.5x the average volume).
ATR-based wicks must be longer than usual (showing a stop-hunt trap).
📌 Step 3: Enter a Trade After a Stop-Hunt
🔹 Bullish Trade (Buying a Dip)
If a green arrow appears (stop-hunt below support):
✅ Enter a long (buy) trade at or just above the wick’s recovery level.
✅ Stop-loss: Below the wick’s low (avoid getting hunted again).
✅ Take-profit: Next resistance level or mid-range of the liquidity zone.
🔹 Bearish Trade (Shorting a Fakeout)
If a red arrow appears (stop-hunt above resistance):
✅ Enter a short (sell) trade at or just below the wick’s rejection level.
✅ Stop-loss: Above the wick’s high (avoid getting stopped out).
✅ Take-profit: Next support level or mid-range of the liquidity zone.
📌 Step 4: Set Alerts & Automate
✅ The indicator triggers alerts when a stop-hunt is detected.
✅ You can set TradingView to notify you instantly when:
A bullish stop-hunt occurs → Look for long entry.
A bearish stop-hunt occurs → Look for short entry.
📌 Example Trade Setup
Example (BTC Long Trade on Stop-Hunt)
BTC is near $40,000 support (green liquidity zone).
A long wick drops to $39,800 with a green arrow (bullish stop-hunt signal).
Volume spikes, and price recovers quickly back above $40,000.
Trade entry: Buy at $40,050.
Stop-loss: Below wick ($39,700).
Take-profit: $41,500 (next resistance).
Result: BTC pumps, stop-loss remains safe, and trade profits.
🔥 Final Tips
Always wait for confirmation (don’t enter blindly on signals).
Use higher timeframes (15m, 1H, 4H) for better accuracy.
Combine with Order Flow tools (like Bookmap) to see real liquidity zones.
🚀 Now try it on TradingView! Let me know if you need adjustments. 📈🔥

ChartArt-Bankniftybuying5minName: ChartArt-BankNifty Buying Strategy (5-Minute)
Timeframe: 5-Minute Candles
Asset: BankNifty (Indian Stock Market Index)
Trading Hours: 9:30 AM - 2:45 PM IST (Indian Standard Time)
This strategy is designed for BankNifty intraday traders who want to capitalize on short-term price movements within a defined trading window. It combines technical indicators like Simple Moving Averages (SMA), Relative Strength Index (RSI), and candlestick patterns to identify potential buy signals during intraday downtrends. The strategy employs specific entry, stop-loss, and target conditions to manage trades effectively and minimize risk.
Technical Indicators Used
Simple Moving Averages (SMA):
EMA7: 7-period SMA on closing price.
EMA5: 5-period SMA on closing price.
Purpose: Used to identify the intraday trend by comparing short-term moving averages. The strategy focuses on situations where the market is in a minor downtrend, indicated by EMA5 being below EMA7.
Relative Strength Index (RSI):
RSI14: 14-period RSI, a momentum oscillator that measures the speed and change of price movements.
SMA14: 14-period SMA of the RSI.
Purpose: RSI is used to identify potential reversal points. The strategy looks for situations where the RSI is below its own moving average, suggesting weakening momentum in the downtrend.
Candlestick Patterns:
Relaxed Hammer or Doji (2nd Candle): A pattern where the second candle in a 3-candle sequence shows a potential reversal signal (Hammer or Doji), indicating indecision or a potential turning point.
Bearish 1st Candle: The first candle is bearish, setting up the context for a potential reversal.
Bullish 3rd Candle: The third candle must be bullish with specific characteristics (closing near the high, surpassing the previous high), confirming the reversal.
Strategy Conditions
Time Condition:
The strategy is only active during specific hours (9:30 AM to 2:45 PM IST). This ensures that trades are only taken during the most liquid hours of the trading day, avoiding potential volatility or lack of liquidity towards market close.
Intraday Downtrend Condition:
EMA5 < EMA7: Indicates that the market is in a minor downtrend. The strategy looks for reversal opportunities within this trend.
RSI Condition:
RSI14 <= SMA14: Indicates that the current RSI value is below its 14-period SMA, suggesting potential weakening momentum, which can precede a reversal.
Candlestick Patterns:
1st Candle: Must be bearish, setting up the context for a potential reversal.
2nd Candle: Must either be a Hammer or Doji, indicating a potential reversal pattern.
3rd Candle: Must be bullish, with specific characteristics (closing near the high, breaking the previous high, etc.), confirming the reversal.
RSI Crossover Condition:
A crossover of the RSI over its SMA in the last 5 periods is also checked, adding further confirmation to the reversal signal.
Entry and Exit Rules
Entry Signal:
A buy signal is generated when all the conditions (time, intraday downtrend, bearish 1st candle, hammer/doji 2nd candle, bullish 3rd candle, and RSI condition) are met. The trade is entered at the high of the bullish third candle.
Stop Loss:
The stop loss is calculated based on the difference between the entry price and the low of the second candle. If this difference is greater than 90 points, the stop loss is placed at the midpoint of the second candle's range (average of high and low). Otherwise, it is placed at the low of the second candle.
Target 1:
The first target is set at 1.8 times the difference between the entry price and the stop loss. When this target is hit, half of the position is exited to lock in partial profits.
Target 2:
The second target is set at 3 times the difference between the entry price and the stop loss. The remaining position is exited at this point, or if the price hits the stop loss.
Originality and Usefulness
This strategy is original in its combination of multiple technical indicators and candlestick patterns to identify potential reversals in a specific intraday timeframe. By focusing on minor downtrends and utilizing a 3-candle reversal pattern, the strategy seeks to capture quick price movements with a structured approach to risk management.
Key Benefits:
High Precision: The strategy’s multi-step filtering process (time condition, trend confirmation, candlestick pattern analysis, and momentum evaluation via RSI) increases the likelihood of accurate trade signals.
Risk Management: The use of a dynamic stop-loss based on candle characteristics, combined with partial profit-taking, allows traders to lock in profits while still giving the trade room to develop further.
Structured Approach: The strategy provides a clear, rule-based system for entering and exiting trades, which can help remove emotional decision-making from the trading process.
Charts and Signals
The strategy produces signals in the form of labels on the chart:
Buy Signal: A green label is plotted below the candle that meets all entry conditions, indicating a potential buy opportunity.
Stop Loss (SL): A red dashed line is drawn at the stop-loss level with a label indicating "SL".
Target 1 (1st TG): A blue dashed line is drawn at the first target level with a label indicating "1st TG".
Target 2 (2nd TG): Another blue dashed line is drawn at the second target level with a label indicating "2nd TG".
These visual aids help traders quickly identify entry points, stop loss levels, and target levels on the chart, making the strategy easy to follow and implement.
Backtesting and Optimization
Backtesting: The strategy can be backtested on TradingView using historical data to evaluate its performance. Traders should consider testing across different market conditions to ensure the strategy's robustness.
Optimization: Parameters such as the RSI period, moving averages, and target multipliers can be optimized based on backtesting results to refine the strategy further.
Conclusion
The ChartArt-BankNifty Buying Strategy offers a well-rounded approach to intraday trading, focusing on capturing reversals in minor downtrends. With a strong emphasis on technical analysis, precise entry and exit rules, and robust risk management, this strategy provides a solid framework for traders looking to engage in intraday trading on BankNifty.

Risk Management Calculator with Fees and Take Profit [CHE]Risk Management Calculator with Fees and Take Profit
Welcome to the Risk Management Calculator with Fees and Take Profit script! This powerful tool is designed to help traders manage their risk effectively, calculate leverage, and set take profit targets. The script is inspired by and builds upon the ideas from the following TradingView script: ().
This script is inspired by and builds upon the ideas from the following TradingView script:
Features
1. Portfolio Size Input: Enter the size of your portfolio to accurately calculate your risk and leverage.
2. Max Loss Percent Input: Specify the maximum percentage of your portfolio that you are willing to risk on a single trade.
3. Max Leverage Input: Set the maximum leverage you are comfortable using.
4. Trading Fee Input: Include trading fees in your calculations to get a more realistic view of your potential losses and gains.
5. ATR Settings: Configure the ATR period and multiplier to calculate your stop loss and take profit levels.
6. RSI Settings: Adjust the RSI period for trend analysis.
How to Use
Portfolio Size
- Description: This is the total value of your trading account.
- Input: `portfolioSize`
- Default Value: 100
- Minimum Value: 0.001
Max Loss Percent
- Description: The maximum percentage of your portfolio you are willing to lose on a single trade.
- Input: `maxLossPercent`
- Default Value: 3%
- Range: 0.1% to 100%
Max Leverage
- Description: The maximum leverage you wish to use.
- Input: `maxLeverage`
- Default Value: 125
- Range: 1 to 125
Trading Fee
- Description: The fee percentage you pay per trade.
- Input: `feeRate`
- Default Value: 1%
- Range: 0% to 10%
ATR Settings
- ATR Period: Number of bars used to calculate the Average True Range.
- Input: `atrPeriod`
- Default Value: 5
- ATR Multiplier: Multiplier for ATR to set stop loss levels.
- Input: `atrMultiplier`
- Default Value: 2.0
Take Profit Multiplier
- Description: Multiplier for ATR to set take profit levels.
- Input: `takeProfitMultiplier`
- Default Value: 2.0
RSI Settings
- RSI Period: Period for the RSI calculation.
- Input: `rsiPeriod`
- Default Value: 14
Dashboard
The script includes a customizable dashboard that displays the following information:
- Portfolio Size
- Maximum Loss Amount
- Entry Price
- Stop Loss Price
- Stop Loss Percentage
- Calculated Leverage
- Order Value
- Order Quantity
- Trend Direction
- Adjusted Maximum Loss Percentage
- Take Profit Price
Dashboard Settings
- Location: Choose the position of the dashboard on the chart.
- Options: 'Top Right', 'Bottom Right', 'Top Left', 'Bottom Left'
- Size: Adjust the size of the dashboard text.
- Options: 'Tiny', 'Small', 'Normal', 'Large'
- Text/Frame Color: Set the color for the text and frame of the dashboard.
Underlying Principles and Assumptions
Leverage Calculation
The leverage calculation is fundamental to risk management in trading. It ensures that the risk per trade does not exceed a specified percentage of the portfolio. This calculation takes into account the potential loss from the entry price to the stop loss level, adjusted for trading fees. By dividing the maximum acceptable loss by the total potential loss (including fees), we derive a leverage that limits the exposure per trade. This approach helps traders avoid over-leveraging, which can lead to significant losses.
ATR and Stop Loss
The Average True Range (ATR) is used to set stop loss levels because it measures market volatility. A higher ATR indicates more volatility, which means wider stop losses are needed to avoid being prematurely stopped out by normal market fluctuations. By using an ATR multiplier, the stop loss is dynamically adjusted based on current market conditions, providing a more robust risk management strategy.
Take Profit Calculation
The take profit level is calculated as a multiple of the ATR, ensuring that it is set at a realistic level relative to market volatility. This method aims to capture significant price movements while avoiding the noise of smaller fluctuations. Setting take profit targets this way helps in locking in profits when the market moves favorably.
RSI for Trend Confirmation
The Relative Strength Index (RSI) is used to confirm the trend direction. An RSI above 50 typically indicates a bullish trend, while an RSI below 50 indicates a bearish trend. By aligning trades with the prevailing trend, the script increases the probability of successful trades. This trend confirmation helps in making informed decisions about leverage and position sizing.
Risk Color Coding
The script uses color coding to visually indicate the risk level and trend direction. Green indicates a favorable condition for long trades, red for short trades, and gray for neutral conditions. This intuitive color coding aids in quickly assessing the market conditions and making timely trading decisions.
Conclusion
This script aims to provide a comprehensive risk management tool for traders. By integrating portfolio size, leverage, fees, ATR, and RSI, it helps in making informed trading decisions. We hope you find this tool useful in your trading journey.
Happy Trading!

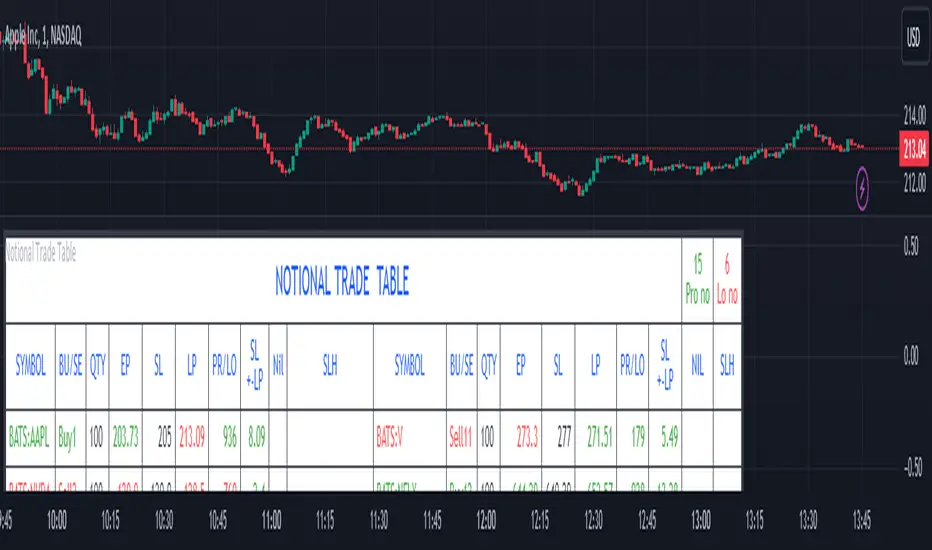
Notional Trade Table
Notional Trade Table indicator displays notional trade values for given Buy and Sell of given input of Symbol, Quantity, Entry Price and Stop Loss .
Sections of Input Menu Table are supported with Tool Tip icons.
Input Symbols:
(Refer Input Menu)
User can choose maximum 20 Symbols.
Input Side Choice (BUY/SELL):
(Refer Input Menu)
After choosing Symbol, User has to choose the BUY or SELL option for each Symbol against the corresponding Sybol number. If NIL is selected “Nil is selected ” message is displayed prompting the user to select BUY or SELL sides.
For example in the above Input Menu:
Sym1 is BATS:AAPL. Corresponding Side 1 is Sell1.
Sym2 is BATS:NVDA Corresponding Side 2 Sell 2.
Sym12 is BATS:NFLX. Corresponding Side 12 is Buy12 and so on.
Input Quantity:
(Refer Input Menu)
Next enter Corresponding Quantity of BUY or SELL in relevant Quantity Input Box. Quantity cannot be Zero. Defval is 1.
For Sym1 input in Qty 1 box,for Sym2 input in Qty 2 box and so on.
Input Entry Price:
(Refer Input Menu)
After entering Quantity Input Entry Price for Corresponding Symbol.
Input for Sym1 Entry Price in EP1 box
Input for Sym2 Entry Price in EP2 box
and so on.
Input Stop Loss:
(Refer Input Menu)
Next Enter corresponding Stop Loss for each Symbol.
SL1 input box denotes Sym1 Stop Loss.
SL2 input box denotes Sym2 Stop Loss.
SL3 input box denotes Sym3 Stop Loss and so on.
Stop Loss for Chosen BUY side should be below corresponding Entry Price/Last Price. Otherwise a message is displayed “SL Hit”. User has to enter valid data.
Stop Loss for Chosen SELL side should be above corresponding Entry Price/Last Price. Otherwise a message is displayed “SL Hit”. User has to enter valid data.
Notional Trade Table:
(Refer the Table on Chart)
From the input menu filled by User script captures the Symbol, BUY/SELL options, Quantity,
Entry Price and Stop Loss details under the corresponding heads in the Notional Trade Table.
The script captures the live Last traded Price under the head LP and calculates and displays corresponding Profit or Loss under PR/LO column in the table.
SL+- LP is the difference between Last traded Price (LP) and Stop Loss Price. Positive figure under this head reflects Stop Loss cushion available .
Nil header column reflects message “NIL selected” prompting the User to select BUY or SELL sides.
SLH header displays “SL Hit” on Stop Loss Hit or wrong input of Stop Loss inconsistent with BUY or SELL sides of Trade. On “SL Hit” message all values in corresponding Symbol becomes Zero. User has to re-enter the details fresh .
On the top left side corner of the table there are 2 cells with Prono and Lono.They denote the number of trades which are in Profit (Prono) and which are in Loss(Lono).
It is preferable to choose Symbols from a single country exchange commensurate with the Time zone. Otherwise if Exchange and Chart time Zone differs there is risk of data loss in the table.
DISCLAIMER: For educational and entertainment purpose only .Nothing in this content should be interpreted as financial advice or a recommendation to buy or sell any sort of security/ies or investment/s.
Mogwai Method with RSI and EMA - BTCUSD 15mThis is a custom TradingView indicator designed for trading Bitcoin (BTCUSD) on a 15-minute timeframe. It’s based on the Mogwai Method—a mean-reversion strategy—enhanced with the Relative Strength Index (RSI) for momentum confirmation. The indicator generates buy and sell signals, visualized as green and red triangle arrows on the chart, to help identify potential entry and exit points in the volatile cryptocurrency market.
Components
Bollinger Bands (BB):
Purpose: Identifies overextended price movements, signaling potential reversions to the mean.
Parameters:
Length: 20 periods (standard for mean-reversion).
Multiplier: 2.2 (slightly wider than the default 2.0 to suit BTCUSD’s volatility).
Role:
Buy signal when price drops below the lower band (oversold).
Sell signal when price rises above the upper band (overbought).
Relative Strength Index (RSI):
Purpose: Confirms momentum to filter out false signals from Bollinger Bands.
Parameters:
Length: 14 periods (classic setting, effective for crypto).
Overbought Level: 70 (price may be overextended upward).
Oversold Level: 30 (price may be overextended downward).
Role:
Buy signal requires RSI < 30 (oversold).
Sell signal requires RSI > 70 (overbought).
Exponential Moving Averages (EMAs) (Plotted but not currently in signal logic):
Purpose: Provides trend context (included in the script for visualization, optional for signal filtering).
Parameters:
Fast EMA: 9 periods (short-term trend).
Slow EMA: 50 periods (longer-term trend).
Role: Can be re-added to filter signals (e.g., buy only when Fast EMA > Slow EMA).
Signals (Triangles):
Buy Signal: Green upward triangle below the bar when price is below the lower Bollinger Band and RSI is below 30.
Sell Signal: Red downward triangle above the bar when price is above the upper Bollinger Band and RSI is above 70.
How It Works
The indicator combines Bollinger Bands and RSI to spot mean-reversion opportunities:
Buy Condition: Price breaks below the lower Bollinger Band (indicating oversold conditions), and RSI confirms this with a reading below 30.
Sell Condition: Price breaks above the upper Bollinger Band (indicating overbought conditions), and RSI confirms this with a reading above 70.
The strategy assumes that extreme price movements in BTCUSD will often revert to the mean, especially in choppy or ranging markets.
Visual Elements
Green Upward Triangles: Appear below the candlestick to indicate a buy signal.
Red Downward Triangles: Appear above the candlestick to indicate a sell signal.
Bollinger Bands: Gray lines (upper, middle, lower) plotted for reference.
EMAs: Blue (Fast) and Orange (Slow) lines for trend visualization.
How to Use the Indicator
Setup
Open TradingView:
Log into TradingView and select a BTCUSD chart from a supported exchange (e.g., Binance, Coinbase, Bitfinex).
Set Timeframe:
Switch the chart to a 15-minute timeframe (15m).
Add the Indicator:
Open the Pine Editor (bottom panel in TradingView).
Copy and paste the script provided.
Click “Add to Chart” to apply it.
Verify Display:
You should see Bollinger Bands (gray), Fast EMA (blue), Slow EMA (orange), and buy/sell triangles when conditions are met.
Trading Guidelines
Buy Signal (Green Triangle Below Bar):
What It Means: Price is oversold, potentially ready to bounce back toward the Bollinger Band middle line.
Action:
Enter a long position (buy BTCUSD).
Set a take-profit near the middle Bollinger Band (bb_middle) or a resistance level.
Place a stop-loss 1-2% below the entry (or based on ATR, e.g., ta.atr(14) * 2).
Best Context: Works well in ranging markets; avoid during strong downtrends.
Sell Signal (Red Triangle Above Bar):
What It Means: Price is overbought, potentially ready to drop back toward the middle line.
Action:
Enter a short position (sell BTCUSD) or exit a long position.
Set a take-profit near the middle Bollinger Band or a support level.
Place a stop-loss 1-2% above the entry.
Best Context: Effective in ranging markets; avoid during strong uptrends.
Trend Filter (Optional):
To reduce false signals in trending markets, you can modify the script:
Add and ema_fast > ema_slow to the buy condition (only buy in uptrends).
Add and ema_fast < ema_slow to the sell condition (only sell in downtrends).
Check the Fast EMA (blue) vs. Slow EMA (orange) alignment visually.
Tips for BTCUSD on 15-Minute Charts
Volatility: BTCUSD can be erratic. If signals are too frequent, increase bb_mult (e.g., to 2.5) or adjust RSI levels (e.g., 75/25).
Confirmation: Use volume spikes or candlestick patterns (e.g., doji, engulfing) to confirm signals.
Time of Day: Mean-reversion works best during low-volume periods (e.g., Asian session in crypto).
Backtesting: Use TradingView’s Strategy Tester (convert to a strategy by adding entry/exit logic) to evaluate performance with historical BTCUSD data up to March 13, 2025.
Risk Management
Position Size: Risk no more than 1-2% of your account per trade.
Stop Losses: Always use stops to protect against BTCUSD’s sudden moves.
Avoid Overtrading: Wait for clear signals; don’t force trades in choppy or unclear conditions.
Example Scenario
Chart: BTCUSD, 15-minute timeframe.
Buy Signal: Price drops to $58,000, below the lower Bollinger Band, RSI at 28. A green triangle appears.
Action: Buy at $58,000, target $59,000 (middle BB), stop at $57,500.
Sell Signal: Price rises to $60,500, above the upper Bollinger Band, RSI at 72. A red triangle appears.
Action: Sell at $60,500, target $59,500 (middle BB), stop at $61,000.
This indicator is tailored for mean-reversion trading on BTCUSD. Let me know if you’d like to tweak it further (e.g., add filters, alerts, or alternative indicators)!

Position Size Calculator for ContractDescription:
Position Size Calculator is a versatile Pine Script tool designed to help traders manage their risk and position sizing effectively. This script calculates essential trading metrics and visualizes them directly on your chart, helping you make informed trading decisions.
Features:
- Account Size & Risk Management:
- Account Size: Input your total account balance to calculate position sizes.
- Maximum Risk: Define how much of your account you are willing to risk per trade in dollars.
- Pip Value: Set the value of a single pip for one contract, which is crucial for calculating risk
and position size.
Trade Setup Visualization:
- Entry Price: Specify the price at which you plan to enter the trade.
- Stop Loss: Define your stop loss level to manage your risk.
- Take Profit: Set your target profit level for the trade.
- Visualize the Entry, Stop Loss, and Take Profit levels on your chart with customizable line
colors and text sizes.
- View the distance in pips between the Entry, Stop Loss, and Take Profit levels.
Position Size Calculation:
- Calculates the number of contracts to open based on your risk tolerance and the pip value.
- Displays the maximum number of contracts you can open given your risk parameters.
Customizable Table Display:
- Table Position: Choose the position of the summary table on the chart (Top-Left, Top-Right,
Bottom-Left, Bottom-Right, etc.).
- Table Text Size: Adjust the text size for the summary table.
- Table Background Color: Set the background color for the summary table.
- Table Border Color: Customize the border color of the summary table.
How to Use:
1- Input your Account Size: Enter your current account balance.
2- Set Maximum Risk and Pip Value: Define how much you're willing to risk per trade and the
pip value for your contract.
3- Define Trade Levels: Input your desired Entry Price, Stop Loss, and Take Profit levels.
4- Customize Visuals: Adjust the line styles and table settings to fit your preferences.
5- View Calculations: The script will display the distance in pips and the calculated position
size directly on your chart.
Example Usage:
Example to calculate the value of 1 pips with 1 contract:
Inputs:
Account Size: Your total trading account balance.
Maximum Risk: Risk amount per trade in dollars.
Pip Value: Value of one pip for a single contract.
Entry Price: The price at which you plan to enter the trade.
Stop Loss: The level at which you will exit the trade to cut losses.
Take Profit: The target price to lock in profits.
Line Text Size: Size of the text for the Entry, Stop Loss, and Take Profit lines.
Line Extend: Option to extend the lines for visual clarity.
Table Position: Position of the summary table on the chart.
Table Text Size: Size of the text in the summary table.
Table Background Color: Background color of the summary table.
Table Border Color: Border color of the summary table.
Visuals:
Entry Price, Stop Loss, and Take Profit levels are clearly marked on the chart.
Summary Table with important trade metrics displayed.

Wolf DCA CalculatorThe Wolf DCA Calculator is a powerful and flexible indicator tailored for traders employing the Dollar Cost Averaging (DCA) strategy. This tool is invaluable for planning and visualizing multiple entry points for both long and short positions. It also provides a comprehensive analysis of potential profit and loss based on user-defined parameters, including leverage.
Features
Entry Price: Define the initial entry price for your trade.
Total Lot Size: Specify the total number of lots you intend to trade.
Percentage Difference: Set the fixed percentage difference between each DCA point.
Long Position: Toggle to switch between long and short positions.
Stop Loss Price: Set the price level at which you plan to exit the trade to minimize losses.
Take Profit Price: Set the price level at which you plan to exit the trade to secure profits.
Leverage: Apply leverage to your trade, which multiplies the potential profit and loss.
Number of DCA Points: Specify the number of DCA points to strategically plan your entries.
How to Use
1. Add the Indicator to Your Chart:
Search for "Wolf DCA Calculator" in the TradingView public library and add it to your chart.
2. Configure Inputs:
Entry Price: Set your initial trade entry price.
Total Lot Size: Enter the total number of lots you plan to trade.
Percentage Difference: Adjust this to set the interval between each DCA point.
Long Position: Use this toggle to choose between a long or short position.
Stop Loss Price: Input the price level at which you plan to exit the trade to minimize losses.
Take Profit Price: Input the price level at which you plan to exit the trade to secure profits.
Leverage: Set the leverage you are using for the trade.
Number of DCA Points: Specify the number of DCA points to plan your entries.
3. Analyze the Chart:
The indicator plots the DCA points on the chart using a stepline style for clear visualization.
It calculates the average entry point and displays the potential profit and loss based on the specified leverage.
Labels are added for each DCA point, showing the entry price and the lots allocated.
Horizontal lines mark the Stop Loss and Take Profit levels, with corresponding labels showing potential loss and profit.
Benefits
Visual Planning: Easily visualize multiple entry points and understand how they affect your average entry price.
Risk Management: Clearly see your Stop Loss and Take Profit levels and their impact on your trade.
Customizable: Adapt the indicator to your specific strategy with a wide range of customizable parameters.

Range Average Retest Model [LuxAlgo]The Range Average Retest Model tool highlights setups from the range average retest entry model, a model using the retest of the average between two opposite swing points as an entry.
This tool uses long-term volatility coupled with user-defined multipliers to filter out swing areas and set take profit and stop loss levels for all trades.
Key features include:
Draw up to 165 swing areas and their associated trades
Filter out swing areas using Pivot Length , Selection Mode and Threshold parameters
Filter out trades with Maximum Distance and Minimum Distance parameters
Enable or disable swing areas and select default colors
Enable or disable overlapping trades and change the default colors for Take Profit and Stop Loss zones
🔶 USAGE
The "Range Average Retest Model" is an entry model that enters a position when the price retests the average made between two swing points. Users can determine the period of the detected swing points from the "Pivot Length" setting.
The conditions for long or short trades, regardless of whether the swing area is bullish or bearish, are as follows:
Long positions: the current bar close is below the swing area average and the last bar close was above it.
Short positions: the current bar close is above the swing area average price and the last bar close was below it.
Each trade is displayed on the chart with a line connecting it to its swing area highlighting the range average, a green area for the take profit, and a red area for the stop loss.
Both the Take Profit and Stop Loss levels are calculated by applying your own multiplier in the settings panel to the long-term volatility measure, in this case, the average true range over the last 200 bars.
Trades will remain open until they reach either the Stop Loss or Take Profit price levels.
🔹 Filtering Swing Areas
The daily chart of the Nasdaq-100 futures (NQ) with pivot length 2 and bullish selection mode: it only detects bullish swing areas, but they are smaller and more numerous.
Traders can manipulate the behavior of the swing areas from the settings panel.
The Selection mode will filter areas by bias: it will detect bullish areas, bearish areas, or both.
The Threshold parameter is applied to the long-term volatility to filter out areas where the average prices are too close together; the higher the value, the greater the difference between the average prices must be.
🔹 Trades
3-minute chart of the Nasdaq-100 futures (NQ) with pivot length 5, bearish selection mode maximum distance 4, and stop loss 2: many trades detected with very asymmetric risk/reward.
The behavior of the trades is also manipulated from the settings panel.
The maximum and minimum distance parameters specify the number of bars a trade must be away from a swing area.
The Take Profit and Stop Loss parameters are applied to the long-term volatility to obtain their respective price levels.
🔹 Overlapping Trades
Same chart as before, but with overlapping trades: messy, right?
By default the tool does not show overlapping trades, this allows for a cleaner chart.
In the settings panel traders can enable overlapping mode, in which case the tool will show all available trades.
Traders must be aware that the chart can be very crowded.
🔶 SETTINGS
🔹 Swings
Pivot Length: How many bars are used to confirm a swing point. The larger this parameter is, the larger and fewer swing areas will be detected.
Selection Mode: Swing area detection mode, detect only bullish swings, only bearish swings, or both.
Threshold: Swing area comparator. This threshold is multiplied by a measure of volatility (average true range over the last 200 bars), for a new swing area to be detected it must have an average level that is sufficiently distant from the average level of any untouched swing area, this parameter controls that distance.
🔹 Trades
Maximum distance: Maximum distance allowed between a swing area and a trade.
Minimum distance: Minimum distance allowed between a swing area and a trade.
Take profit: The size of the take profit - this threshold is multiplied by a measure of volatility (the average true range over the last 200 bars).
Stop loss: The size of the stop-loss: this threshold is multiplied by a measure of volatility (the average true range over the last 200 bars).

Portfolio Backtester Engine█ OVERVIEW
Portfolio Backtester Engine (PBTE). This tool will allow you to backtest strategies across multiple securities at once. Allowing you to easier understand if your strategy is robust. If you are familiar with the PineCoders backtesting engine , then you will find this indicator pleasant to work with as it is an adaptation based on that work. Much of the functionality has been kept the same, or enhanced, with some minor adjustments I made on the account of creating a more subjectively intuitive tool.
█ HISTORY
The original purpose of the backtesting engine (`BTE`) was to bridge the gap between strategies and studies . Previously, strategies did not contain the ability to send alerts, but were necessary for backtesting. Studies on the other hand were necessary for sending alerts, but could not provide backtesting results . Often, traders would have to manage two separate Pine scripts to take advantage of each feature, this was less than ideal.
The `BTE` published by PineCoders offered a solution to this issue by generating backtesting results under the context of a study(). This allowed traders to backtest their strategy and simultaneously generate alerts for automated trading, thus eliminating the need for a separate strategy() script (though, even converting the engine to a strategy was made simple by the PineCoders!).
Fast forward a couple years and PineScript evolved beyond these issues and alerts were introduced into strategies. The BTE was not quite as necessary anymore, but is still extremely useful as it contains extra features and data not found under the strategy() context. Below is an excerpt of features contained by the BTE:
"""
More than `40` built-in strategies,
Customizable components,
Coupling with your own external indicator,
Simple conversion from Study to Strategy modes,
Post-Exit analysis to search for alternate trade outcomes,
Use of the Data Window to show detailed bar by bar trade information and global statistics, including some not provided by TV backtesting,
Plotting of reminders and generation of alerts on in-trade events.
"""
Before I go any further, I want to be clear that the BTE is STILL a good tool and it is STILL very useful. The Portfolio Backtesting Engine I am introducing is only a tangental advancement and not to be confused as a replacement, this tool would not have been possible without the `BTE`.
█ THE PROBLEM
Most strategies built in Pine are limited by one thing. Data. Backtesting should be a rigorous process and researchers should examine the performance of their strategy across all market regimes; that includes, bullish and bearish markets, ranging markets, low volatility and high volatility. Depending on your TV subscription The Pine Engine is limited to 5k-20k historical bars available for backtesting, which can often leave the strategy results wanting. As a general rule of thumb, strategies should be tested across a quantity of historical bars which will allow for at least 100 trades. In many cases, the lack of historical bars available for backtesting and frequency of the strategy signals produces less than 100 trades, rendering your strategy results inconclusive.
█ THE SOLUTION
In order to be confident that we have a robust strategy we must test it across all market regimes and we must have over 100 trades. To do this effectively, researchers can use the Portfolio Backtesting Engine (PBTE).
By testing a strategy across a carefully selected portfolio of securities, researchers can now gather 5k-20k historical bars per security! Currently, the PTBE allows up to 5 securities, which amounts to 25k-100k historical bars.
█ HOW TO USE
1 — Add the indicator to your chart.
• Confirm inputs. These will be the most important initial values which you can change later by clicking the gear icon ⚙ and opening up the settings of the indicator.
2 — Select a portfolio.
• You will want to spend some time carefully selecting a portfolio of securities.
• Each security should be uncorrelated.
• The entire portfolio should contain a mix of different market regimes.
You should understand that strategies generally take advantage of one particular type of market regime. (trending, ranging, low/high volatility)
For example, the default RSI strategy is typically advantageous during ranging markets, whereas a typical moving average crossover strategy is advantageous in trending markets.
If you were to use the standard RSI strategy during a trending market, you might be selling when you should be buying.
Similarily, if you use an SMA crossover during a ranging market, you will find that the MA's may produce many false signals.
Even if you build a strategy that is designed to be used only in a trending market, it is still best to select a portfolio of all market regimes
as you will be able to test how your strategy will perform when the market does something unexpected.
3 — Test a built-in strategy or add your own.
• Navigate to gear icon ⚙ (settings) of strategy.
• Choose your options.
• Select a Main Entry Strat and Alternate Entry Strat .
• If you want to add your own strategy, you will need to modify the source code and follow the built-in example.
• You will only need to generate (buy 1 / sell -1/ neutral 0) signals.
• Select a Filter , by default these are all off.
• Select an Entry Stop - This will be your stop loss placed at the trade entry.
• Select Pyamiding - This will allow you to stack positions. By default this is off.
• Select Hard Exits - You can also think of these as Take Profits.
• Let the strategy run and take note of the display tables results.
• Portfolio - Shows each security.
• The strategy runs on each asset in your portfolio.
• The initial capital is equally distributed across each security.
So if you have 5 securities and a starting capital of 100,000$ then each security will run the strategy starting with 20,000$
The total row will aggregate the results on a bar by bar basis showing the total results of your initial capital.
• Net Profit (NP) - Shows profitability.
• Number of Trades (#T) - Shows # of trades taken during backtesting period.
• Typically will want to see this number greater than 100 on the "Total" row.
• Average Trade Length (ATL) - Shows average # of days in a trade.
• Maximum Drawdown (MD ) - Max peak-to-valley equity drawdown during backtesting period.
• This number defines the minimum amount of capital required to trade the system.
• Typically, this shouldn’t be lower than 34% and we will want to allow for at least 50% beyond this number.
• Maximum Loss (ML) - Shows largest loss experienced on a per-trade basis.
• Normally, don’t want to exceed more than 1-2 % of equity.
• Maximum Drawdown Duration (MDD) - The longest duration of a drawdown in equity prior to a new equity peak.
• This number is important to help us psychologically understand how long we can expect to wait for a new peak in account equity.
• Maximum Consecutive Losses (MCL) - The max consecutive losses endured throughout the backtesting period.
• Another important metric for trader psychology, this will help you understand how many losses you should be prepared to handle.
• Profit to Maximum Drawdown (P:MD) - A ratio for the average profit to the maximum drawdown.
• The higher the ratio is, the better. Large profits and small losses contribute to a good PMD.
• This metric allows us to examine the profit with respect to risk.
• Profit Loss Ratio (P:L) - Average profit over the average loss.
• Typically this number should be higher in trend following systems.
• Mean reversion systems show lower values, but compensate with a better win %.
• Percent Winners (% W) - The percentage of winning trades.
• Trend systems will usually have lower win percentages, since statistically the market is only trending roughly 30% of the time.
• Mean reversion systems typically should have a high % W.
• Time Percentage (Time %) - The amount of time that the system has an open position.
• The more time you are in the market, the more you are exposed to market risk, not to mention you could be using that money for something else right?
• Return on Investment (ROI) - Your Net Profit over your initial investment, represented as a percentage.
• You want this number to be positive and high.
• Open Profit (OP) - If the strategy has any open positions, the floating value will be represented here.
• Trading Days (TD) - An important metric showing how many days the strategy was active.
• This is good to know and will be valuable in understanding how long you will need to run this strategy in order to achieve results.
█ FEATURES
These are additional features that extend the original `BTE` features.
- Portfolio backtesting.
- Color coded performance results.
- Circuit Breakers that will stop trading.
- Position reversals on exit. (Simulating the function of always in the market. Similar to strategy.entry functionality)
- Whipsaw Filter
- Moving Average Filter
- Minimum Change Filter
- % Gain Equity Exit
- Popular strategies, (MACD, MA cross, supertrend)
Below are features that were excluded from the original `BTE`
- 2 stage in-trade stops with kick-in rules (This was a subjective decision to remove. I found it to be complex and thwarted my use of the `BTE` for some time.)
- Simple conversion from Study to Strategy modes. (Not possible with multiple securities)
- Coupling with your own external indicator (Not really practical to use with multiple securities, but could be used if signals were generated based on some indicator which was not based on the current chart)
- Use of the Data Window to show detailed bar by bar trade information and global statistics.
- Post Exit Analysis.
- Plotting of reminders and generation of alerts on in-trade events.
- Alerts (These may be added in the future by request when I find the time.)
█ THANKS
The whole PineCoders team for all their shared knowledge and original publication of the BTE and Richard Weismann for his ideas on building robust strategies.
═════════════════════════════════════════════════════════════════════════

AO Smart Scalper – 5M Dynamic SL Edition📈 AO Signals with Fixed and Dynamic SL – Optimized for 5-Minute Charts 📉
This indicator is built for 5-minute timeframe trading, combining powerful momentum signals from the Awesome Oscillator (AO) with both Fixed and Dynamic Stop Loss (SL) levels to enhance trade management and risk control.
✅ Buy/Sell Signals:
The indicator generates clear BUY and SELL signals based on the AO crossing above or below the zero line, helping traders capture momentum shifts early.
🛑 Fixed Stop Loss:
Each trade signal comes with a Fixed SL, calculated based on the high (for shorts) or low (for longs) of the previous candle, with a customizable percentage offset. This SL is plotted with a red line, providing a clear initial risk level.
⚡ Dynamic Stop Loss: Continuous Presence, Strategic Use:
A secondary Dynamic SL line is plotted, which is continuously present on the chart. This dynamic level responds to market conditions and can serve as a trailing stop or key decision point.
💡 Recommended Use: It is recommended to actively start using the Dynamic SL once the trade has moved into profit. This allows protecting obtained profits and minimizing the risk of losses in case of a market reversal.
🛡️ Enhanced Dynamic Stop-Loss Strategy:
🔒 Initial Protection: Utilize the Fixed SL as the initial stop-loss, placed below relevant lows (for longs) or above relevant highs (for shorts), or as provided by the fixed SL indicator.
🛤️ Dynamic Tracking:
🟢 Long Trades: Once in profit, the Dynamic SL will dynamically adjust, moving upwards as higher lows are formed, effectively trailing the price and securing profits.
🔴 Short Trades: Conversely, in short trades, once in profit, the Dynamic SL will move downwards as lower highs are formed, protecting gains.
🔄 Alternatively the dynamic stop loss will follow the dynamic SL line provided by the indicator.
🚪 Exiting Trades: When the price crosses below the Dynamic SL line in a LONG trade, or above it in a SHORT trade, the recommended action is to exit the trade.
↩️ Re-entry Consideration: You may consider re-entering only if the price clearly returns above the Dynamic SL (for longs) or below it (for shorts).
⚠️ IMPORTANT - 5-Minute Strategy Guidance ⏱️
This tool is specifically optimized for the 5-minute timeframe. This approach helps filter out weak setups and maintain discipline in volatile market conditions.
✨ Additional Features:
👁️ Visual and editable SL levels
📊 200-period SMA for trend context
💻 Simple and effective interface for intraday trading setups
🎯 Ideal for traders seeking a clean, rule-based system that combines momentum entry signals with layered stop loss protection.
🔑 Key Changes:
It was emphasized that the Dynamic SL is always present, but its active use is recommended once the trade is in profit.
It was clarified the use of the Fixed SL, giving the option to use the one provided by the indicator, or to place it according to the price action.

Quantum State Superposition Indicator (QSSI)Quantum State Superposition Indicator (QSSI) - Where Physics Meets Finance
The Quantum Revolution in Market Analysis
After months of research into quantum mechanics and its applications to financial markets, I'm thrilled to present the Quantum State Superposition Indicator (QSSI) - a groundbreaking approach that models price action through the lens of quantum physics. This isn't just another technical indicator; it's a paradigm shift in how we understand market behavior.
The Theoretical Foundation
Quantum Superposition in Markets
In quantum mechanics, particles exist in multiple states simultaneously until observed. Similarly, markets exist in a superposition of potential states (bullish, bearish, neutral) until a significant volume event "collapses" the wave function into a definitive direction.
The mathematical framework:
Wave Function (Ψ): Represents the market's quantum state as a weighted sum of all possible states:
Ψ = Σ(αᵢ × Sᵢ)
Where αᵢ are probability amplitudes and Sᵢ are individual quantum states.
Probability Amplitudes: Calculated using the Born rule, normalized so Σ|αᵢ|² = 1
Observation Operator: Volume/Average Volume ratio determines observation strength
The Five Quantum States
Momentum State: Short-term price velocity (EMA of returns)
Mean Reversion State: Deviation from equilibrium (normalized z-score)
Volatility Expansion State: ATR relative to historical average
Trend Continuation State: Long-term price positioning
Chaos State: Volatility of volatility (market uncertainty)
Each state contributes to the overall wave function based on current market conditions.
Wave Function Collapse
When volume exceeds the observation threshold (default 1.5x average), the wave function "collapses," committing the market to a direction. This models how institutional volume forces markets out of uncertainty into trending states.
Collapse Detection Formula:
Collapse = Volume > (Threshold × Average Volume)
Direction = Sign(Ψ) at collapse moment
Advanced Quantum Concepts
Heisenberg Uncertainty Principle
The indicator calculates market uncertainty as the product of price and momentum
uncertainties:
ΔP × ΔM = ℏ (market uncertainty constant)
This manifests as dynamic uncertainty bands that widen during unstable periods.
Quantum Tunneling
Calculates the probability of price "tunneling" through resistance/support barriers:
P(tunnel) = e^(-2×|barrier_height|×√coherence_length)
Unlike classical technical analysis, this gives probability of breakouts before they occur.
Entanglement
Measures the quantum correlation between price and volume:
Entanglement = |Correlation(Price, Volume, lookback)|
High entanglement suggests coordinated institutional activity.
Decoherence
When market states lose quantum properties and behave classically:
Decoherence = 1 - Σ(amplitude²)
Indicates trend emergence from quantum uncertainty.
Visual Innovation
Probability Clouds
Three-tier probability distributions visualize market uncertainty:
Inner Cloud (68%): One standard deviation - most likely price range
Middle Cloud (95%): Two standard deviations - probable extremes
Outer Cloud (99.7%): Three standard deviations - tail risk zones
Cloud width directly represents market uncertainty - wider clouds signal higher entropy states.
Quantum State Visualization
Colored dots represent individual quantum states:
Green: Momentum state strength
Red: Mean reversion state strength
Yellow: Volatility state strength
Dot brightness indicates amplitude (influence) of each state.
Collapse Events
Aqua Diamonds (Above): Bullish collapse - upward commitment
Pink Diamonds (Below): Bearish collapse - downward commitment
These mark precise moments when markets exit superposition.
Implementation Details
Core Calculations
Feature Extraction: Normalize price returns, volume ratios, and volatility measures
State Calculation: Compute each quantum state's value
Amplitude Assignment: Weight states by market conditions and observation strength
Wave Function: Sum weighted states for final market quantum state
Visualization: Transform quantum values to price space for display
Performance Optimization
- Efficient array operations for state calculations
- Single-pass normalization algorithms
- Optimized correlation calculations for entanglement
- Smart label management to prevent visual clutter
Trading Applications:
Signal Generation
Bullish Signals:
- Positive wave function during collapse
- High tunneling probability at support
- Coherent market state with bullish bias
Bearish Signals:
- Negative wave function during collapse
- High tunneling probability at resistance
- Decoherent state transitioning bearish
Risk Management
Uncertainty-Based Position Sizing:
Narrow clouds: Normal position size
Wide clouds: Reduced position size
Extreme uncertainty: Stay flat
Quantum Stop Losses:
- Place stops outside probability clouds
- Adjust for Heisenberg uncertainty
- Respect quantum tunneling levels
Market Regime Recognition
Quantum Coherent (Superposed):
- Market in multiple states
- Avoid directional trades
- Prepare for collapse
Quantum Decoherent (Classical):
-Clear trend emergence
- Follow directional signals
- Traditional analysis applies
Advanced Features
Adaptive Dashboards
Quantum State Panel: Real-time wave function, dominant state, and coherence status
Performance Metrics: Win rate, signal frequency, and regime analysis
Information Guide: Comprehensive explanation of all quantum concepts
- All dashboards feature adjustable sizing for different screen resolutions.
Multi-Timeframe Quantum Analysis
The indicator adapts to any timeframe:
Scalping (1-5m): Short coherence length, sensitive thresholds
Day Trading (15m-1H): Balanced parameters
Swing Trading (4H-1D): Long coherence, stable states
Alert System
Sophisticated alerts for:
- Wave function collapse events
- Decoherence transitions
- High tunneling probability
- Strong entanglement detection
Originality & Innovation
This indicator introduces several firsts:
Quantum Superposition: First to model markets as quantum systems
Wave Function Collapse: Original volume-triggered state commitment
Tunneling Probability: Novel breakout prediction method
Entanglement Metrics: Unique price-volume quantum correlation
Probability Clouds: Revolutionary uncertainty visualization
Development Journey
Creating QSSI required:
- Deep study of quantum mechanics principles
- Translation of physics equations to market context
- Extensive backtesting across multiple markets
- UI/UX optimization for trader accessibility
- Performance optimization for real-time calculation
- The result bridges cutting-edge physics with practical trading.
Best Practices
Parameter Optimization
Quantum States (2-5):
- 2-3 for simple markets (forex majors)
- 4-5 for complex markets (indices, crypto)
Coherence Length (10-50):
- Lower for fast markets
- Higher for stable markets
Observation Threshold (1.0-3.0):
- Lower for active markets
- Higher for thin markets
Signal Confirmation
Always confirm quantum signals with:
- Market structure (support/resistance)
- Volume patterns
- Correlated assets
- Fundamental context
Risk Guidelines
- Never risk more than 2% per trade
- Respect probability cloud boundaries
- Exit on decoherence shifts
- Scale with confidence levels
Educational Value
QSSI teaches advanced concepts:
- Quantum mechanics applications
- Probability theory
- Non-linear dynamics
- Risk management
- Market microstructure
Perfect for traders seeking deeper market understanding.
Disclaimer
This indicator is for educational and research purposes only. While quantum mechanics provides a fascinating framework for market analysis, no indicator can predict future prices with certainty. The probabilistic nature of both quantum mechanics and markets means outcomes are inherently uncertain.
Always use proper risk management, conduct thorough analysis, and never risk more than you can afford to lose. Past performance does not guarantee future results.
Conclusion
The Quantum State Superposition Indicator represents a revolutionary approach to market analysis, bringing institutional-grade quantum modeling to retail traders. By viewing markets through the lens of quantum mechanics, we gain unique insights into uncertainty, probability, and state transitions that classical indicators miss.
Whether you're a physicist interested in finance or a trader seeking cutting-edge tools, QSSI opens new dimensions in market analysis.
"The market, like Schrödinger's cat, exists in multiple states until observed through volume."
* As you may have noticed, the past two indicators I've released (Lorentzian Classification and Quantum State Superposition) are designed with strategy implementation in mind. I'm currently developing a stable execution platform that's completely unique and moves away from traditional ATR-based position sizing and stop loss systems. I've found ATR-based approaches to be unreliable in volatile markets and regime transitions - they often lag behind actual market conditions and can lead to premature exits or oversized positions during volatility spikes.
The goal is to create something that adapts to market conditions in real-time using the quantum and relativistic principles we've been exploring. Hopefully I'll have something groundbreaking to share soon. Stay tuned!
Trade with quantum insight. Trade with QSSI .
— Dskyz , for DAFE Trading Systems

Multi-Factor Reversal AnalyzerMulti-Factor Reversal Analyzer – Quantitative Reversal Signal System
OVERVIEW
Multi-Factor Reversal Analyzer is a comprehensive technical analysis toolkit designed to detect market tops and bottoms with high precision. It combines trend momentum analysis, price action behavior, wave oscillation structure, and volatility breakout potential into one unified indicator.
This indicator is not a random mix of tools — each module is carefully selected for a specific purpose. When combined, they form a multi-dimensional view of the market, merging trend analysis, momentum divergence, and volatility compression to produce high-confidence signals.
Why Combine These Modules?
Module Combination Ideas & How to Use Them
Factor A: Trend Detector + Gold Zone
Concept:
• The Trend Detector (light yellow histogram) evaluates market strength:
• Histogram trending downward or staying below 50 → bearish conditions;
• Trending upward or staying above 50 → bullish conditions.
• The Gold Zone identifies areas of volatility compression — typically a prelude to explosive market moves.
Practical Application:
• When the Gold Zone appears and the Trend Detector is bearish → likely downside move;
• When the Gold Zone appears and the Trend Detector is bullish → likely upside breakout.
• Note: The Gold Zone does not mean the bottom is in. It is not a buy signal on its own — always combine it with other modules for directional bias.
Factor B: PAI + Wave Trend
Concept:
• PAI (Price Action Index) is a custom oscillator that combines price momentum with volatility dispersion, displaying strength zones:
• Green area → bullish dominance;
• Red area → bearish pressure.
• Wave Trend offers smoothed crossover signals via the main and signal lines.
Practical Application:
• When PAI is in the green zone and Wave Trend makes a bullish crossover → potential reversal to the upside;
• When PAI is in the red zone and Wave Trend shows a bearish crossover → potential start of a downtrend.
Factor C: Trend Detector + PAI
Concept:
• Combines directional trend strength with price action strength to confirm setups via confluence.
Practical Application:
• Trend Detector histogram bottoms out + PAI enters the green zone → high chance of upward reversal;
• Histogram tops out + PAI in the red zone → increased likelihood of downside continuation.
Multi-Factor Confluence (Advanced Use)
• When Trend Detector, PAI, and Wave Trend all align in the same direction (bullish or bearish), the directional signal becomes significantly more reliable.
• This setup is especially useful for trend-following or swing trade entries.
KEY FEATURES
1. Multi-Layer Reversal Logic
• Combines trend scoring, oscillator divergence, and volatility squeezes for triangulated reversal detection.
• Helps traders distinguish between trend pullbacks and true reversals.
2. Advanced Divergence Detection
• Detects both regular and hidden divergences using pivot-based confirmation logic.
• Customizable lookback ranges and pivot sensitivity provide flexible tuning for different market styles.
3. Gold Zone Volatility Compression
• Highlights pre-breakout zones using custom oscillation models (RSI, harmonic, Karobein, etc.).
• Improves anticipation of breakout opportunities following low-volatility compressions.
4. Trend Direction Context
• PAI and Trend Score components provide top-down insight into prevailing bias.
• Built-in “Straddle Area” highlights consolidation zones; breakouts from this area often signal new trend phases.
5. Flexible Visualization
• Color-coded trend bars, reversal markers, normalized oscillator plots, and trend strength labels.
• Designed for both visual discretionary traders and data-driven system developers.
USAGE GUIDELINES
1. Applicable Markets
• Suitable for stocks, crypto, futures, and forex
• Supports reversal, mean-reversion, and breakout trading styles
2. Recommended Timeframes
• Short-term traders: 5m / 15m / 1H — use Wave Trend divergence + Gold Zone
• Swing traders: 4H / Daily — rely on Price Action Index and Trend Detector
• Macro trend context: use PAI HTF mode for higher timeframe overlays
3. Reversal Strategy Flow
• Watch for divergence (WT/PAI) + Gold Zone compression
• Confirm with Trend Score weakening or flipping
• Use Straddle Area breakout for final trigger
• Optional: enable bar coloring or labels for visual reinforcement
• The indicator performs optimally when used in conjunction with a harmonic pattern recognition tool
4. Additional Note on the Gold Zone
The “Gold Zone” does not directly indicate a market bottom. Since it is displayed at the bottom of the chart, it may be misunderstood as a bullish signal. In reality, the Gold Zone represents a compression of price momentum and volatility, suggesting that a significant directional move is about to occur. The direction of that move—upward or downward—should be determined by analyzing the histogram:
• If histogram momentum is weakening, the Gold Zone may precede a downward move.
• If histogram momentum is strengthening, it may signal an upcoming rebound or rally.
Treat the Gold Zone as a warning of impending volatility, and always combine it with trend indicators for accurate directional judgment.
RISK DISCLAIMER
• This indicator calculates trend direction based on historical data and cannot guarantee future market performance. When using this indicator for trading, always combine it with other technical analysis tools, fundamental analysis, and personal trading experience for comprehensive decision-making.
• Market conditions are uncertain, and trend signals may result in false positives or lag. Traders should avoid over-reliance on indicator signals and implement stop-loss strategies and risk management techniques to reduce potential losses.
• Leverage trading carries high risks and may result in rapid capital loss. If using this indicator in leveraged markets (such as futures, forex, or cryptocurrency derivatives), exercise caution, manage risks properly, and set reasonable stop-loss/take-profit levels to protect funds.
• All trading decisions are the sole responsibility of the trader. The developer is not liable for any trading losses. This indicator is for technical analysis reference only and does not constitute investment advice.
• Before live trading, it is recommended to use a demo account for testing to fully understand how to use the indicator and apply proper risk management strategies.
CHANGELOG
v1.0: Initial release featuring integrated Price Action Index, Trend Strength Scoring, Wave Trend Oscillator, Gold Zone Compression Detection, and dual-type divergence recognition. Supports higher timeframe (HTF) synchronization, visual signal markers, and diversified parameter configurations.

Rachas ATR AssistHey Traders!
This indicator is a simple, it uses Average True Range (ATR) data from the daily chart and the current timeframe to estimate potential range and volatility.
This indicator compares the daily ATR to the current daily wick range (from low to high), helping you gauge how much "room" might be left for price movement within the day. Alongside that, it shows the ATR over the last 14 candles and 5 candles on your current chart for intraday volatility awareness—ideal for setting stops, targets, or position sizing.
Gauge Daily Potential Movement:
The "Day Range Difference" cell shows how much of the expected daily range (based on ATR) is still unfilled. If the market has moved less than the average, there's still potential for expansion. If it's close to or above the ATR, expect a slowdown or reversal.
Position Sizing & Stop Losses:
Use the 14-period ATR and 5-period ATR on your current timeframe to understand recent volatility. This helps in choosing logical stop loss levels and adjusting position sizes based on market conditions.
Volatility Awareness:
Knowing the average daily range and how much of it has been used lets you avoid entering trades too late in the move or placing stops in overly tight spots.
Table Position & Font:
You can adjust the table location (top/bottom left/right) and font size to best fit your chart layout.

Volatility Layered Supertrend [NLR]We’ve all used Supertrend, but do you know where to actually enter a trade? Volatility Layered Supertrend (VLS) is here to solve that! This advanced trend-following indicator builds on the classic Supertrend by not only identifying trends and their strength but also guiding you to the best trade entry points. VLS divides the main long-term trend into “Strong” and “Weak” Zones, with a clear “Trade Entry Zone” to help you time your trades with precision. With layered trends, dynamic profit targets, and volatility-adaptive bands, VLS delivers actionable signals for any market.
Why I Created VLS Over a Plain Supertrend
I built VLS to address the gaps in traditional Supertrend usage and make trade entries clearer:
Single-Line Supertrend Issues: The default Supertrend sets stop-loss levels that are too wide, making it impractical for most traders to use effectively.
Unclear Entry Points: Standard Supertrend doesn’t tell you where to enter a trade, often leaving you guessing or entering too early or late.
Multi-Line Supertrend Enhancement: Many traders use short, medium, and long Supertrends, which is helpful but can lack focus. In VLS, I include Short, Medium, and Long trends (using multipliers 1 to 3), and add multipliers 4 and 5 to track extra long-term trends—helping to avoid fakeouts that sometimes occur with multiplier 3.
My Solution: I focused on the main long-term Supertrend and split it into “Weak Zone” and “Strength Zone” to show the trend’s reliability. I also defined a “Trade Entry Zone” (starting from the Mid Point, with the first layer’s background hidden for clarity) to guide you on where to enter trades. The zones include Short, Medium, and Long Trend layers for precise entries, exits, and stop-losses.
Practical Trading: This approach provides realistic stop-loss levels, clear entry points, and a “Profit Target” line that aligns with your risk tolerance, while filtering out false signals with longer-term trends.
Key Features
Layered Trend Zones: Short, Medium, Long, and Extra Long Trend layers (up to multipliers 4 and 5) for timing entries and exits.
Strong & Weak Zones: See when the trend is reliable (Strength Zone) or needs caution (Weak Zone).
Trade Entry Zone: A dedicated zone starting from the Mid Point (first layer’s background hidden) to show the best entry points.
Dynamic Profit Targets: A “Profit Target” line that adjusts with the trend for clear goals.
Volatility-Adaptive: Uses ATR to adapt to market conditions, ensuring reliable signals.
Color-Coded: Green for uptrends, red for downtrends—simple and clear.
How It Works
VLS enhances the main long-term Supertrend by dividing it into two zones:
Weak Zone: Indicates a less reliable trend—use tighter stop-losses or wait for the price to reach the Trade Entry Zone.
Strength Zone: Signals a strong trend—ideal for entries with wider stop-losses for bigger moves.
The “Trade Entry Zone” starts at the Mid Point (last layer’s background hidden for clarity), showing you the best area to enter trades. Each zone includes Short, Medium, Long, and Extra Long Trend sublevels (up to multipliers 4 and 5) for precise trade timing and to filter out fakeouts. The “Profit Target” updates dynamically based on trend direction and volatility, giving you a clear goal.
How to Use
Spot the Trend: Green bands = buy, red bands = sell.
Check Strength: Price in Strength Zone? Trend’s reliable—trade confidently. In Weak Zone? Use tighter stops or wait.
Enter Trades: Use the “Trade Entry Zone” (from the Mid Point upward) for the best entry points.
Use Sublevels: Short, Medium, Long, and Extra Long layers in each zone help fine-tune entries and exits.
Set Targets: Follow the Profit Target line for goals—it updates automatically.
Combine Tools: Pair with RSI, MACD, or support/resistance for added confirmation.
Settings
ATR Length: Adjust the ATR period (default 10) to change sensitivity.
Up/Down Colors: Customize colors—green for up, red for down, by default.

*Auto Backtest & Optimize EngineFull-featured Engine for Automatic Backtesting and parameter optimization. Allows you to test millions of different combinations of stop-loss and take profit parameters, including on any connected indicators.
⭕️ Key Futures
Quickly identify the optimal parameters for your strategy.
Automatically generate and test thousands of parameter combinations.
A simple Genetic Algorithm for result selection.
Saves time on manual testing of multiple parameters.
Detailed analysis, sorting, filtering and statistics of results.
Detailed control panel with many tooltips.
Display of key metrics: Profit, Win Rate, etc..
Comprehensive Strategy Score calculation.
In-depth analysis of the performance of different types of stop-losses.
Possibility to use to calculate the best Stop-Take parameters for your position.
Ability to test your own functions and signals.
Customizable visualization of results.
Flexible Stop-Loss Settings:
• Auto ━ Allows you to test all types of Stop Losses at once(listed below).
• S.VOLATY ━ Static stop based on volatility (Fixed, ATR, STDEV).
• Trailing ━ Classic trailing stop following the price.
• Fast Trail ━ Accelerated trailing stop that reacts faster to price movements.
• Volatility ━ Dynamic stop based on volatility indicators.
• Chandelier ━ Stop based on price extremes.
• Activator ━ Dynamic stop based on SAR.
• MA ━ Stop based on moving averages (9 different types).
• SAR ━ Parabolic SAR (Stop and Reverse).
Advanced Take-Profit Options:
• R:R: Risk/Reward ━ sets TP based on SL size.
• T.VOLATY ━ Calculation based on volatility indicators (Fixed, ATR, STDEV).
Testing Modes:
• Stops ━ Cyclical stop-loss testing
• Pivot Point Example ━ Example of using pivot points
• External Example ━ Built-in example how test functions with different parameters
• External Signal ━ Using external signals
⭕️ Usage
━ First Steps:
When opening, select any point on the chart. It will not affect anything until you turn on Manual Start mode (more on this below).
The chart will immediately show the best results of the default Auto mode. You can switch Part's to try to find even better results in the table.
Now you can display any result from the table on the chart by entering its ID in the settings.
Repeat steps 3-4 until you determine which type of Stop Loss you like best. Then set it in the settings instead of Auto mode.
* Example: I flipped through 14 parts before I liked the first result and entered its ID so I could visually evaluate it on the chart.
Then select the stop loss type, choose it in place of Auto mode and repeat steps 3-4 or immediately follow the recommendations of the algorithm.
Now the Genetic Algorithm at the bottom right will prompt you to enter the Parameters you need to search for and select even better results.
Parameters must be entered All at once before they are updated. Enter recommendations strictly in fields with the same names.
Repeat steps 5-6 until there are approximately 10 Part's left or as you like. And after that, easily pour through the remaining Parts and select the best parameters.
━ Example of the finished result.
━ Example of use with Takes
You can also test at the same time along with Take Profit. In this example, I simply enabled Risk/Reward mode and immediately specified in the TP field Maximum RR, Minimum RR and Step. So in this example I can test (3-1) / 0.1 = 20 Takes of different sizes. There are additional tips in the settings.
━
* Soon you will start to understand how the system works and things will become much easier.
* If something doesn't work, just reset the engine settings and start over again.
* Use the tips I have left in the settings and on the Panel.
━ Details:
Sort ━ Sorting results by Score, Profit, Trades, etc..
Filter ━ Filtring results by Score, Profit, Trades, etc..
Trade Type ━ Ability to disable Long\Short but only from statistics.
BackWin ━ Backtest Window Number of Candle the script can test.
Manual Start ━ Enabling it will allow you to call a Stop from a selected point. which you selected when you started the engine.
* If you have a real open position then this mode can help to save good Stop\Take for it.
1 - 9 Сheckboxs ━ Allow you to disable any stop from Auto mode.
Ex Source - Allow you to test Stops/Takes from connected indicators.
Connection guide:
//@version=6
indicator("My script")
rsi = ta.rsi(close, 14)
buy = not na(rsi) and ta.crossover (rsi, 40) // OS = 40
sell = not na(rsi) and ta.crossunder(rsi, 60) // OB = 60
Signal = buy ? +1 : sell ? -1 : 0
plot(Signal, "🔌Connector🔌", display = display.none)
* Format the signal for your indicator in a similar style and then select it in Ex Source.
⭕️ How it Works
Hypothesis of Uniform Distribution of Rare Elements After Mixing.
'This hypothesis states that if an array of N elements contains K valid elements, then after mixing, these valid elements will be approximately uniformly distributed.'
'This means that in a random sample of k elements, the proportion of valid elements should closely match their proportion in the original array, with some random variation.'
'According to the central limit theorem, repeated sampling will result in an average count of valid elements following a normal distribution.'
'This supports the assumption that the valid elements are evenly spread across the array.'
'To test this hypothesis, we can conduct an experiment:'
'Create an array of 1,000,000 elements.'
'Select 1,000 random elements (1%) for validation.'
'Shuffle the array and divide it into groups of 1,000 elements.'
'If the hypothesis holds, each group should contain, on average, 1~ valid element, with minor variations.'
* I'd like to attach more details to My hypothesis but it won't be very relevant here. Since this is a whole separate topic, I will leave the minimum part for understanding the engine.
Practical Application
To apply this hypothesis, I needed a way to generate and thoroughly mix numerous possible combinations. Within Pine, generating over 100,000 combinations presents significant challenges, and storing millions of combinations requires excessive resources.
I developed an efficient mechanism that generates combinations in random order to address these limitations. While conventional methods often produce duplicates or require generating a complete list first, my approach guarantees that the first 10% of possible combinations are both unique and well-distributed. Based on my hypothesis, this sampling is sufficient to determine optimal testing parameters.
Most generators and randomizers fail to accommodate both my hypothesis and Pine's constraints. My solution utilizes a simple Linear Congruential Generator (LCG) for pseudo-randomization, enhanced with prime numbers to increase entropy during generation. I pre-generate the entire parameter range and then apply systematic mixing. This approach, combined with a hybrid combinatorial array-filling technique with linear distribution, delivers excellent generation quality.
My engine can efficiently generate and verify 300 unique combinations per batch. Based on the above, to determine optimal values, only 10-20 Parts need to be manually scrolled through to find the appropriate value or range, eliminating the need for exhaustive testing of millions of parameter combinations.
For the Score statistic I applied all the same, generated a range of Weights, distributed them randomly for each type of statistic to avoid manual distribution.
Score ━ based on Trade, Profit, WinRate, Profit Factor, Drawdown, Sharpe & Sortino & Omega & Calmar Ratio.
⭕️ Notes
For attentive users, a little tricks :)
To save time, switch parts every 3 seconds without waiting for it to load. After 10-20 parts, stop and wait for loading. If the pause is correct, you can switch between the rest of the parts without loading, as they will be cached. This used to work without having to wait for a pause, but now it does slower. This will save a lot of time if you are going to do a deeper backtest.
Sometimes you'll get the error “The scripts take too long to execute.”
For a quick fix you just need to switch the TF or Ticker back and forth and most likely everything will load.
The error appears because of problems on the side of the site because the engine is very heavy. It can also appear if you set too long a period for testing in BackWin or use a heavy indicator for testing.
Manual Start - Allow you to Start you Result from any point. Which in turn can help you choose a good stop-stick for your real position.
* It took me half a year from idea to current realization. This seems to be one of the few ways to build something automatic in backtest format and in this particular Pine environment. There are already better projects in other languages, and they are created much easier and faster because there are no limitations except for personal PC. If you see solutions to improve this system I would be glad if you share the code. At the moment I am tired and will continue him not soon.
Also You can use my previosly big Backtest project with more manual settings(updated soon)

Wick Size in USD with 10-Bar AverageWick Size in USD with 10-Bar Average
Version: 1.0
Author: QCodeTrader
🔍 Overview
This indicator converts the price wicks of your candlestick chart into USD values based on ticks, providing both raw and smoothed data via a 10-bar simple moving average. It helps traders visualize the monetary impact of price extremes, making it easier to assess volatility, potential risk, and plan appropriate stop loss levels.
⚙️ Key Features
Tick-Based Calculation:
Converts wick sizes into ticks (using a fixed tick size of 0.01, typical for stocks) and then into USD using a customizable tick value.
10-Bar Moving Average:
Smooths out the wick values over the last 10 bars, giving you a clearer view of average wick behavior.
Bullish/Bearish Visual Cues:
The chart background automatically highlights bullish candles in green and bearish candles in red for quick visual assessment.
Stop Loss Optimization:
The indicator highlights long wick sizes, which can help you set more accurate stop loss levels. Even when the price moves in your favor, long wicks may indicate potential reversals—allowing you to account for this risk when planning your stop losses.
User-Friendly Customization:
Easily adjust the USD value per tick through the settings to tailor the indicator to your specific instrument.
📊 How It Works
Wick Calculation:
The indicator calculates the upper and lower wicks by measuring the distance between the candle’s high/low and its body (open/close).
Conversion to Ticks & USD:
These wick sizes are first converted from price points to ticks (dividing by a fixed tick size of 0.01) and then multiplied by the user-defined tick value to convert the measurement into USD.
Smoothing Data:
A 10-bar simple moving average is computed for both the upper and lower wick values, providing smoothed data that helps identify trends and deviations.
Visual Representation:
Columns display the raw wick sizes in USD.
Lines indicate the 10-bar moving averages.
Background Color shifts between green (bullish) and red (bearish) based on candle type.
⚡ How to Use
Add the Indicator:
Apply it to your chart to begin visualizing wick sizes in monetary terms.
Customize Settings:
Adjust the Tick Value in USD in the settings to match your instrument’s tick value.
(Note: The tick size is fixed at 0.01, which is standard for many stocks.)
Optimize Your Stop Loss:
Analyze the raw and averaged wick values to understand volatility. Long wicks—even when the price moves in your favor—may indicate potential reversals. This insight can help you set more accurate stop loss levels to protect your gains.
Analyze:
Use the indicator’s data to gauge market volatility and assess the significance of price movements, aiding in more informed trading decisions.
This indicator is perfect for traders looking to understand the impact of extreme price movements in monetary terms, optimize stop loss levels, and effectively manage risk across stocks and other instruments with similar tick structures.

SL ManagerSTOP LOSS MANAGER
Overview:
The "SL Manager" indicator is designed to assist traders in managing their stop loss (SL) and take profit (TP) levels for both long and short positions. This tool helps you visualize intermediate levels, enhancing your trading decisions by providing crucial information on the chart.
Usage:
This indicator is particularly useful for traders who want to manage their trades more effectively by visualizing potential adjustment points for their stop loss and take profit levels. It helps in making informed decisions to maximize profits and minimize risks by providing clear levels to take partial profits and adjust stop losses.
Features:
Position Input: Select between "long" and "short" positions.
Entry Price: Specify the entry price of your trade.
Take Profit: Define the price level at which you want to take profit.
Stop Loss: Set the stop loss price level to manage your risk.
Intermediate Levels:
For both long and short positions, the indicator calculates and plots the following intermediate levels:
50% Take Profit (TP 50%): Midway between the entry price and the take profit level, where you can take partial profits and move your SL up to the 25% mark.
75% Take Profit (TP 75%): Three-quarters of the way from the entry price to the take profit level, where you can take partial profits and move your SL to breakeven.
Stop Loss Move to 25% (SL Move to 25%): A level where the stop loss can be adjusted to lock in profits.
Visualization:
The indicator plots the calculated levels directly on the chart, provided the data for the current day is available. Different color codes and line styles distinguish between the various levels:
TP 50% and TP 75% are plotted in green.
SL Move to 25% is plotted in red .
Entry/Breakeven is plotted in blue.
